> ## Documentation Index
> Fetch the complete documentation index at: https://dune-automated-update-duneapi-openapi-files.mintlify.site/llms.txt
> Use this file to discover all available pages before exploring further.
# Tables
> Format and customize table visualizations including column alignment, number formatting, and progress bars.
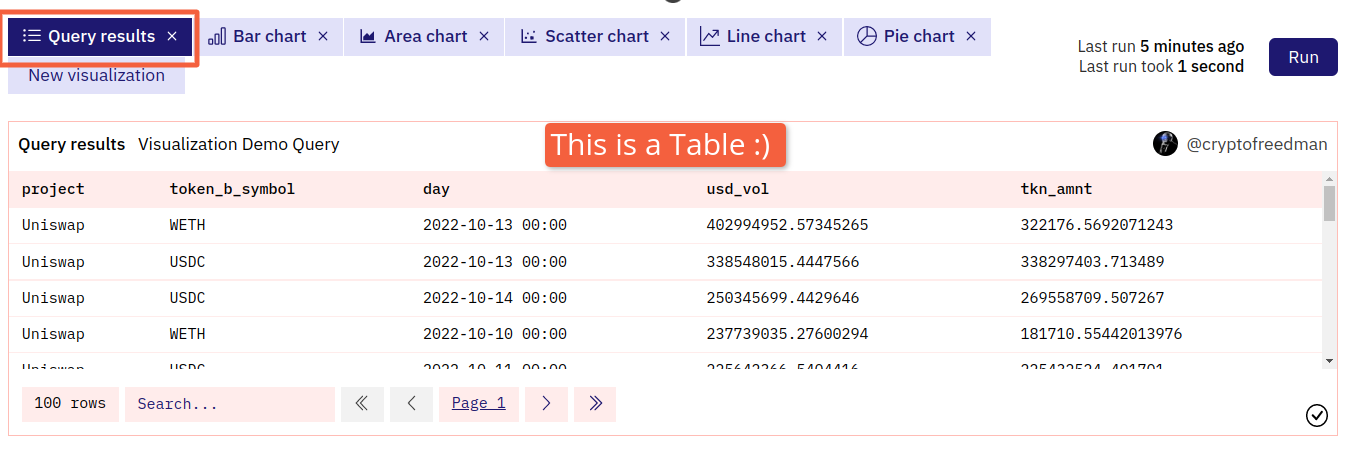
**Tables are the default Visualization whenever you create and run a Query.**
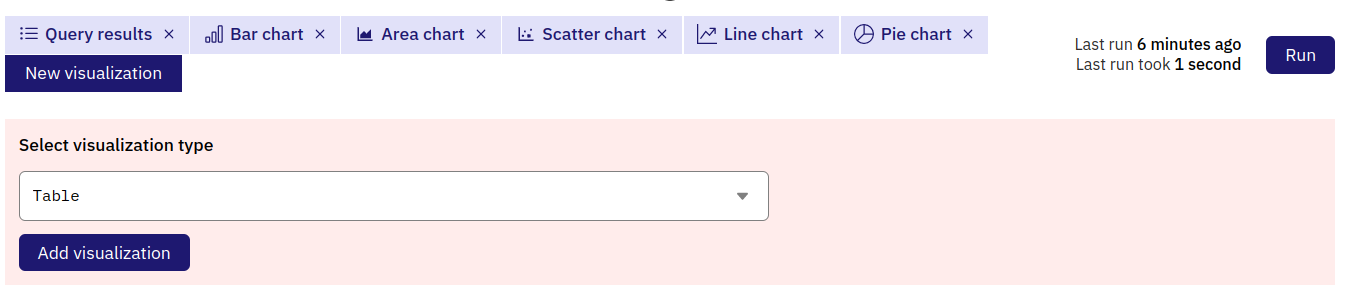
 You can also make more Tables to display your data differently using the New visualization button and drop down menu:
 ### Configuring your Table
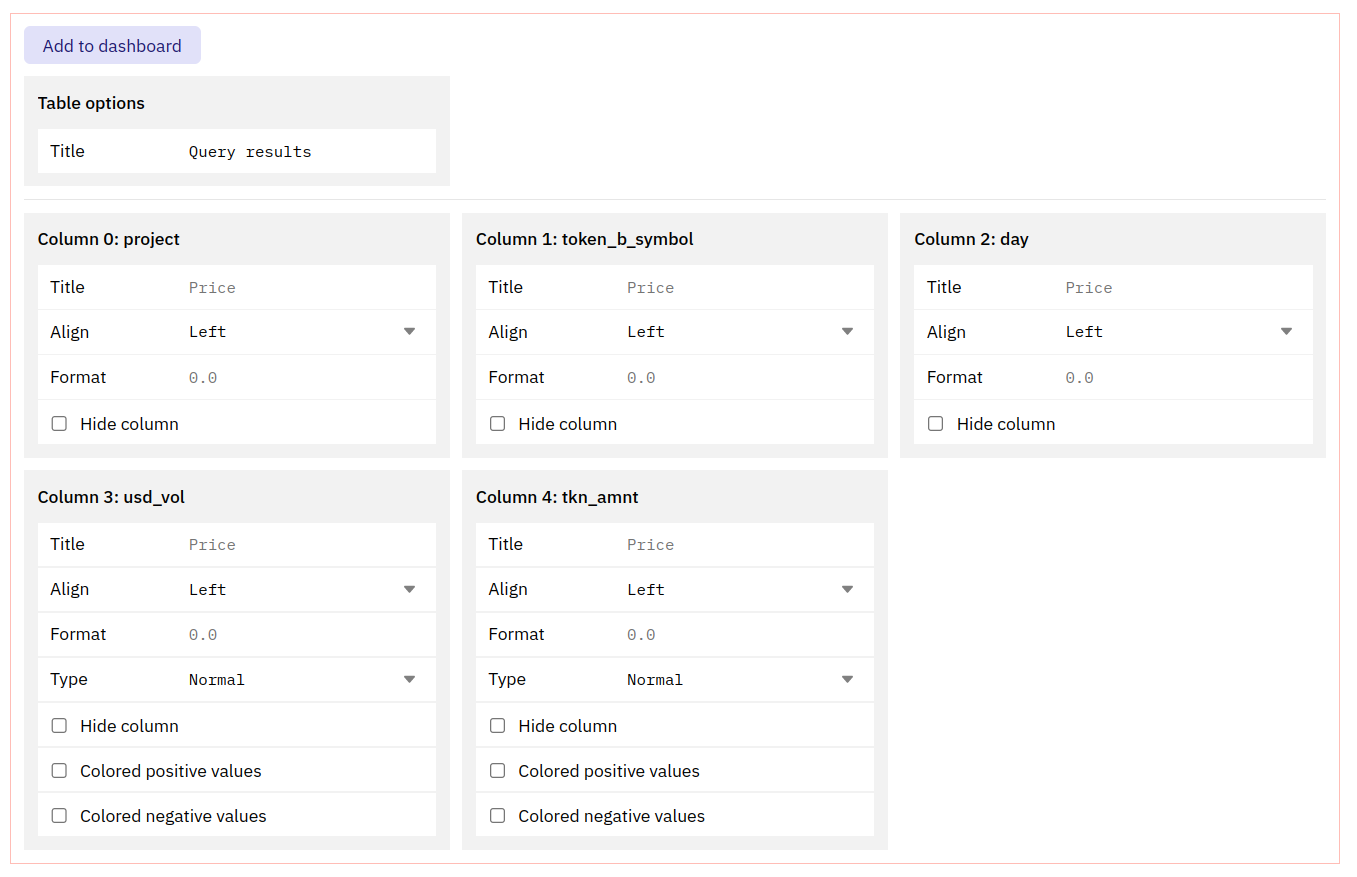 #### Table options
**Title**
The Title appears at the top of your Table.
Leaving default value (`Table`) or making this blank makes your Table title the same as your Query's title/name.
Adding any other value to this field will add that value first, followed by your Query Name:
#### Table options
**Title**
The Title appears at the top of your Table.
Leaving default value (`Table`) or making this blank makes your Table title the same as your Query's title/name.
Adding any other value to this field will add that value first, followed by your Query Name:
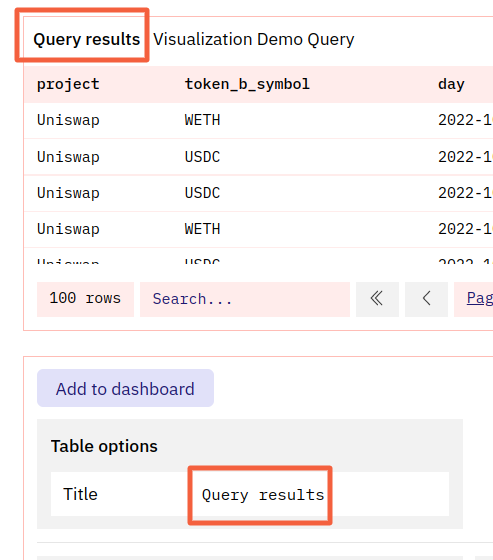 Note: the default value for "Query Results" is treated like an added value.
#### "Column `[x]`:" options
You can configure the following options for each column in your Table
The Title appears at the top of your Table.
Leaving this blank makes your column title the same as its Dune database name.
This changes the text alignment for the column data and title.
Allows you to adjust the numerical format of your data following the [X/Y-axis Tick and Label formats here](/web-app/visualizations/charts-graphs).
Hides this column from your table.
#### Numerical Column options
Columns that return numerical data have these additional options:
* `Normal` simply displays the column's numerical data.
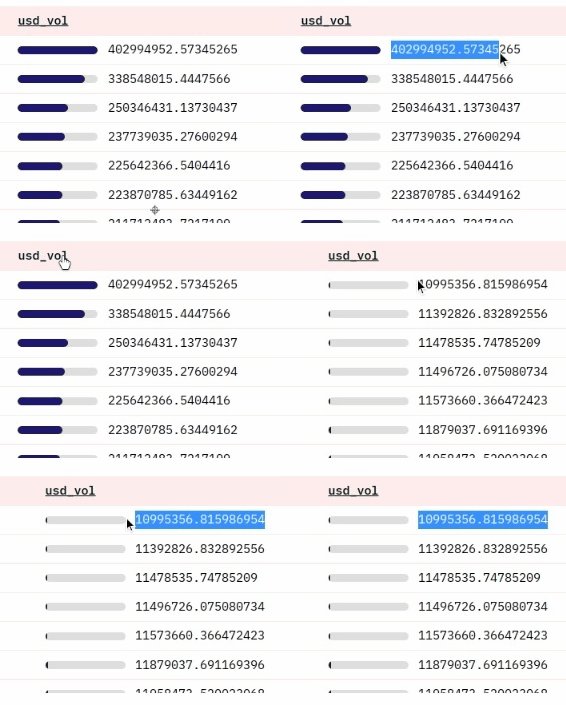
* `Progress bar` shows the column's numerical data with a progress bar visual that is "full" for the column's highest value and "nearly empty" for the column's lowest value, with the rest of the data ranging in between:
Note: the default value for "Query Results" is treated like an added value.
#### "Column `[x]`:" options
You can configure the following options for each column in your Table
The Title appears at the top of your Table.
Leaving this blank makes your column title the same as its Dune database name.
This changes the text alignment for the column data and title.
Allows you to adjust the numerical format of your data following the [X/Y-axis Tick and Label formats here](/web-app/visualizations/charts-graphs).
Hides this column from your table.
#### Numerical Column options
Columns that return numerical data have these additional options:
* `Normal` simply displays the column's numerical data.
* `Progress bar` shows the column's numerical data with a progress bar visual that is "full" for the column's highest value and "nearly empty" for the column's lowest value, with the rest of the data ranging in between: